Science as a Form of Storytelling
Dec 30, 2021
An essay on the narrative structure of Science
Introduction
Narrative and story-telling are often presented as something opposed to “science” or the scientific method. Myths, fairy-tales, and stories are seen as primitive ways of describing natural phenomena or fantastical recountings of subjective experiences, while science is objective, quantitative, and real. In short science is just a superior way of describing the world.
But what if science was just one of the many tools that we have to describe the world and that fundamentally it is like the other tools that our species uses to describe things, a form of story-telling? The scientific paradigm can be described as a story with different characters; microscopic or macroscopic forces replacing the gods or heroes, technical language and numbers with many significant digits replacing poetical language to describe phenomena. My contention is that models, as mathematically and scientifically rigorous as some may be, are stories. And, just some stories are true… some models are true while others are false. For this essay I will focus in on the lipid hypothesis, or the lipid narrative.
Ancel Keys and the Seven Countries Study
Starting in the 1960s, Western medicine took a dramatic turn in nutrition and diet. This was characterized by a marked decrease in consumption of animal fats like butter and lard and an increase in consumption of unsaturated fats (mainly vegetable oils). You may have heard of the saying that cholesterol clogs the arteries. It is an interpretation of measured phenomena pertaining to cardiovascular health. And that’s okay! I do not say it is narrative driven to discount it. Rather, I am merely saying that all data must, at one point or the next, be converted into a narrative structure in order for us to understand data.
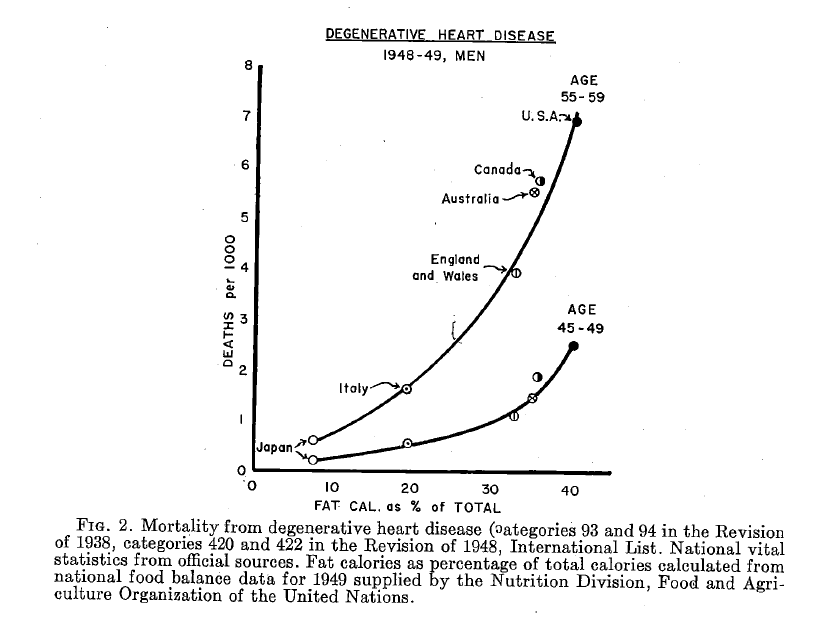
This story starts with Ancel Keys who wrote Atherosclerosis: A Problem in Newer Public Health [1] in 1953 and later directed the Seven Countries Study (SCS) [2] in 1958. In the former, Keys famously (or infamously) published this graph showing a strong correlation between consumption of fat and deaths from degenerative heart disease. What story is being told here? That there is a suspicious relationship between eating fatty foods, and dying from heart disease. The victims are humans, and the enemy is fat! Or is it? Keys presented this information before the World Health Organization in 1955, and some of his peers were not convinced. Jacob Yerushalmy and Herman Hilleboe who also attended the same meeting published their own paper in 1957 countering Keys’ points which I will discuss later.
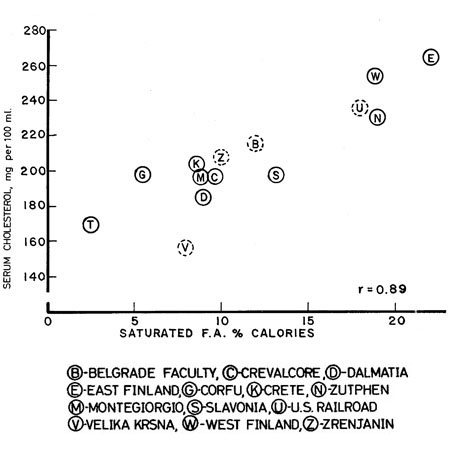
This story continues in his later more well-known work the Seven Countries Study, which focused more on saturated fat rather than fat in general as the driver of disease. The main characters are the diet and biomarkers of 12,763 men aged 40-59 from the US, Finland, Italy, Greece, Japan, Yugoslavia, and the Netherlands. The men’s blood cholesterol, blood pressure, BMI, and electrocardiograms (ECGs) were measured by researchers to establish a baseline and then the cohorts were revisited in 5, 10, and 15 years to gather data on their biomarkers, and cause of death if a participant passed away. Their diets were recorded mainly through seven-day diet recall diaries, and their food was weighed by dieticians. Samples were also sent to the University of Minnesota for chemical analyses for macronutrient breakdown.
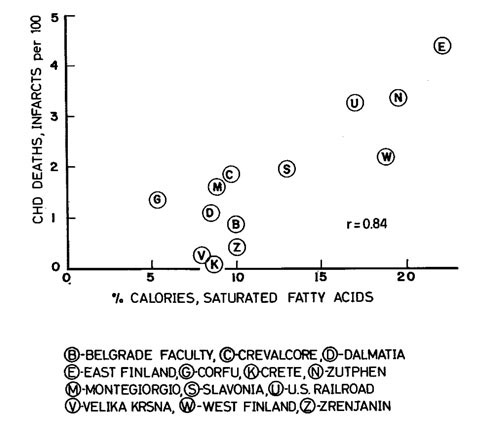
What the researchers found was that countries with lower rates of saturated fat consumption (Greece & Japan) happened to have lower serum cholesterol levels as well as lower rates of CHD deaths, and the North Karelia cohort in Finland, which had the highest consumption of saturated fats, also had the highest rate of deaths from heart disease. So the story is clear isn’t it? Diets high in saturated fats correlate with high serum cholesterol. High serum cholesterol correlates with CHD deaths. Therefore saturated fats correlate with CHD deaths.
The result of this study along with the Hegsted Equation and Framingham Heart Study was the 1961 American Heart Association publication which advocated for a reduction of saturated fats in favor of polyunsaturated fats (PUFAs) [3] and later the publishing of the Dietary Guidelines for Americans by the USDA in 1980. This recommended a reduction of dietary consumption of fat and animal products, including meat, dairy, and eggs. In short, it inspired a crusade against fat. Later on in 1992, the food pyramid was created by the USDA (as shown below in Figure 3) with which many people are familiar. It recommends 6-11 servings of simple carbs a day. Following the food pyramid carb recommendations would require eating 12 ounces of pasta at minimum and 22 ounces of pasta at maximum every day. For context, one regular box of pasta is 16 oz.
The Narrative Structure of Scientific Models
What makes scientific studies “narrative-driven” is this. It must always condense details to a level that is digestible and informative. There is an infinite variety of details that the scientists could have focused on within the scope of the study but didn’t. For example, common critique of the SCS include:
- It didn’t differentiate between different types of cholesterol namely High density lipids (LDL) vs Low density lipids (LDL) which are better biomarkers for cardiovascular disease
- It didn’t differentiate between vegetable oils that are mainly composed of omega-6 fatty acids such as corn oil and soybean oil vs those that are mainly composed of omega-9 and omega-3 fatty acids such as avocado oil and olive oil. High ratios of omega-6 to other fatty acids are associated with inflammation, heart disease, and other chronic illnesses
- It only studied 7 countries, mainly Western industrialized nations and in the case of Japan also an industrialized nation. It did so despite having access to 16 more countries as Yerushalmy and Hilleboe note in their study. Other criticisms leveled by this paper included the use of food inventories of countries to estimate diets, which cannot account for food waste. “For example, it is highly probable that far more dietary fat is throw into waste cans in the United States than in less fortunate countries”. [4].
It reasonably excluded details such as
- A recollection of their childhood and marriage life of each of the participants of the study
- The participant’s thoughts on the diet and possible causes of heart disease
- The hair and eye color of each participant
- The weather conditions during the study
- The political structure of each country
- The folkstories associated with their traditional foods explaining their origin
Analogously, stories do not include every single detail. They describe only things that are relevant. For example, 1984 by Orwell doesn’t go into the macronutrient breakdown of the slop that the citizens of Oceania are served, nor does it need to do a technical breakdown of the hardware of the telescreens that surveil every residence of Oceania. Every story, (including scientific studies) must necessarily include certain elements that are relevant and exclude those that are not relevant.
Inclusion and Exclusion - French and Inuit Paradox
Stories are extremely conscious about what elements to include because they will either contribute to the point of the story, be irrelevant, or worse detract from the point of their story. For the same reasons stories are conscious of what elements to exclude. To show how this is applicable to scientific inquires I have done a couple of statistical analyses below, the first couple “debunking” the first figure I referenced from Key’s work that associates fat as percentage of total calories with CHD deaths, and the second doing a similar thing for Figure 3, which associates saturated fat as percentage of calories with CHD deaths.
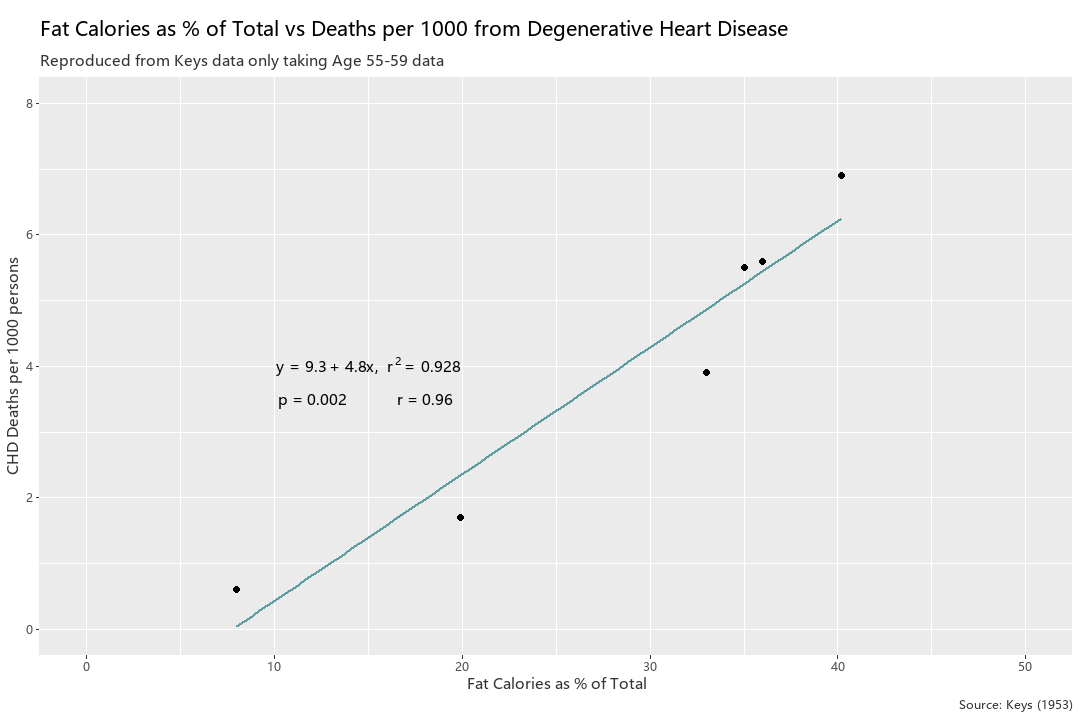
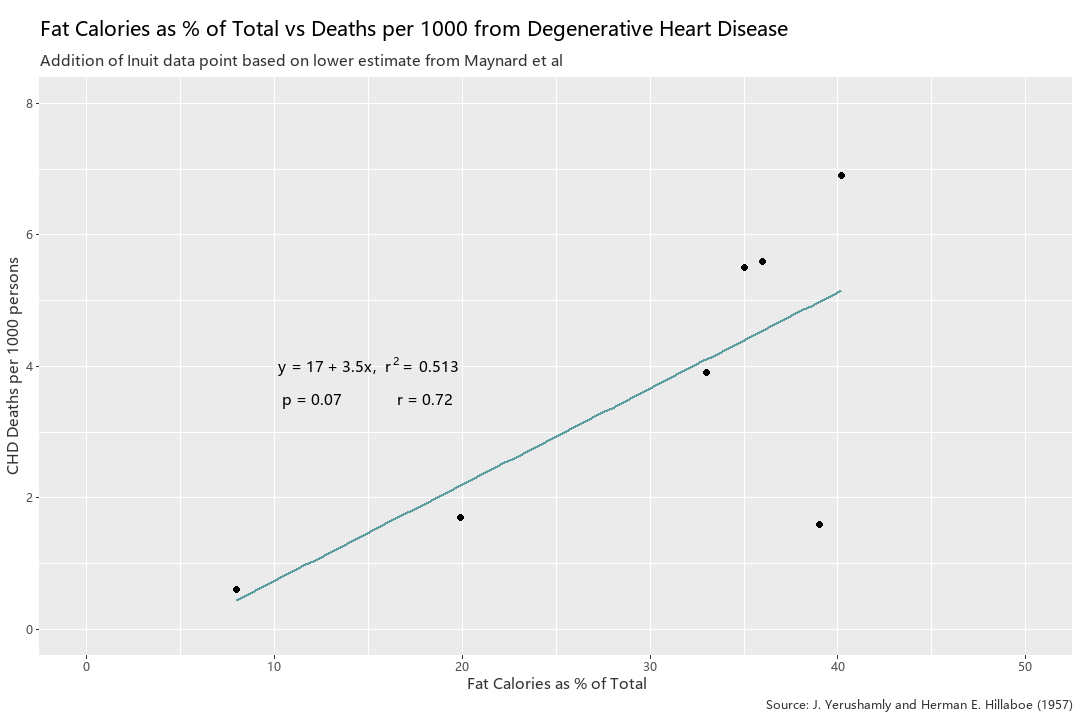
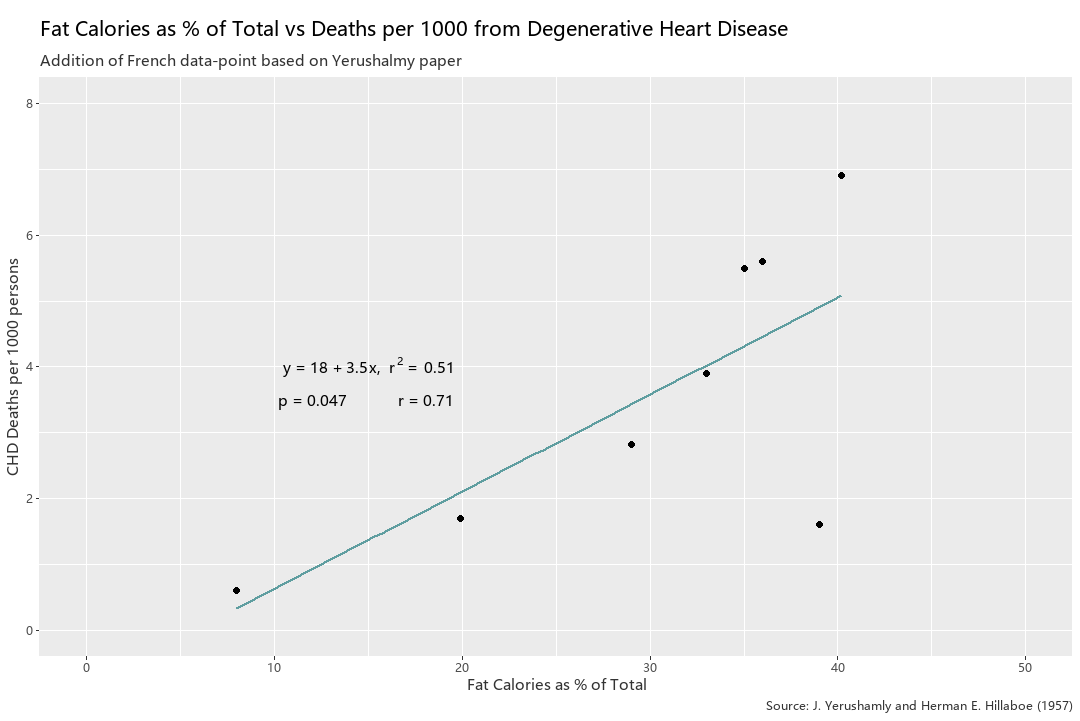
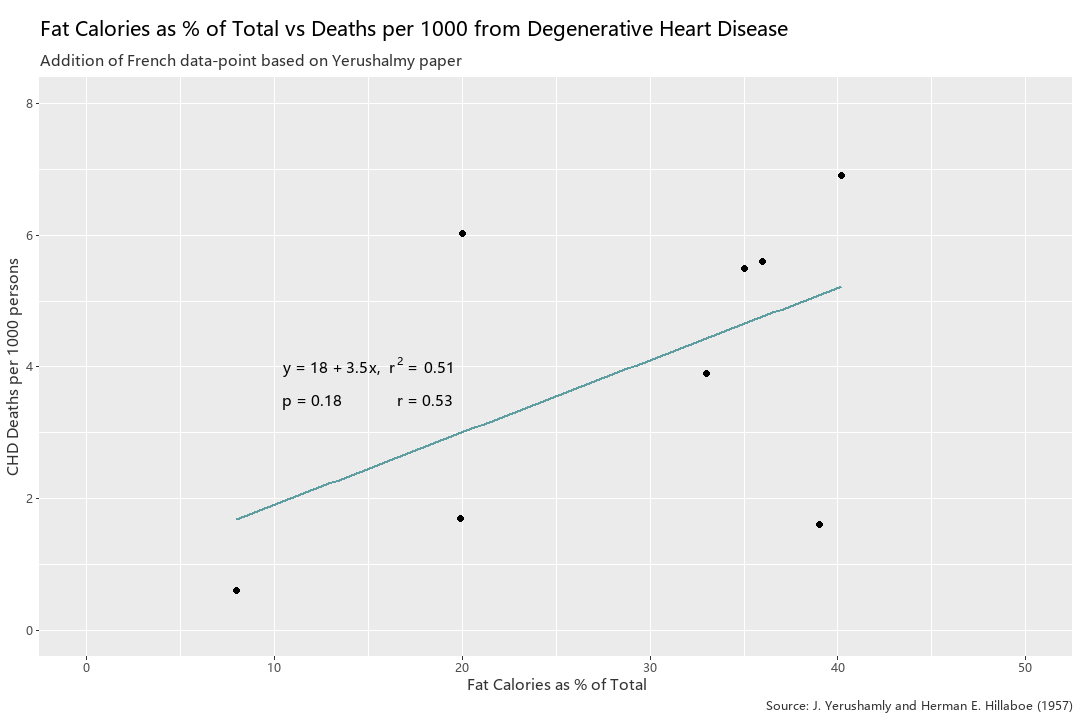
The first thing I did was re-create Figure 3 in R. Then I began adding data points, using data from a paper on heart disease among Alaskan natives [5] and the Yerusalmy paper for the Chilean and French data [4]. When comparing Figure 5 to Figure 8, the addition of 3 data points (Inuit, French, and Chilean) creates a much weaker model and hence a weaker narrative. It is higher than .05, the alpha value that is typically acceptable for statistical significance, as p is now .18, whereas it was a very statistically significant figure of .002 in Figure 5. Additionally, the r value fell from the very high range of .96 to .53 in Figure 8. Of course, I am cherry picking data to discredit the model, but this is just to demonstrate, in a similar manner that Yerushalmy had in 1957, that the inclusion of more data often changes the story. It went from… “Consumption of dietary fat definitely is related to heart disease” to something like “It is possible that dietary fat is related to heart disease but there are many outliers that under current limitations cannot be explained” Below I will do a similar thing to SCS Figure 3.
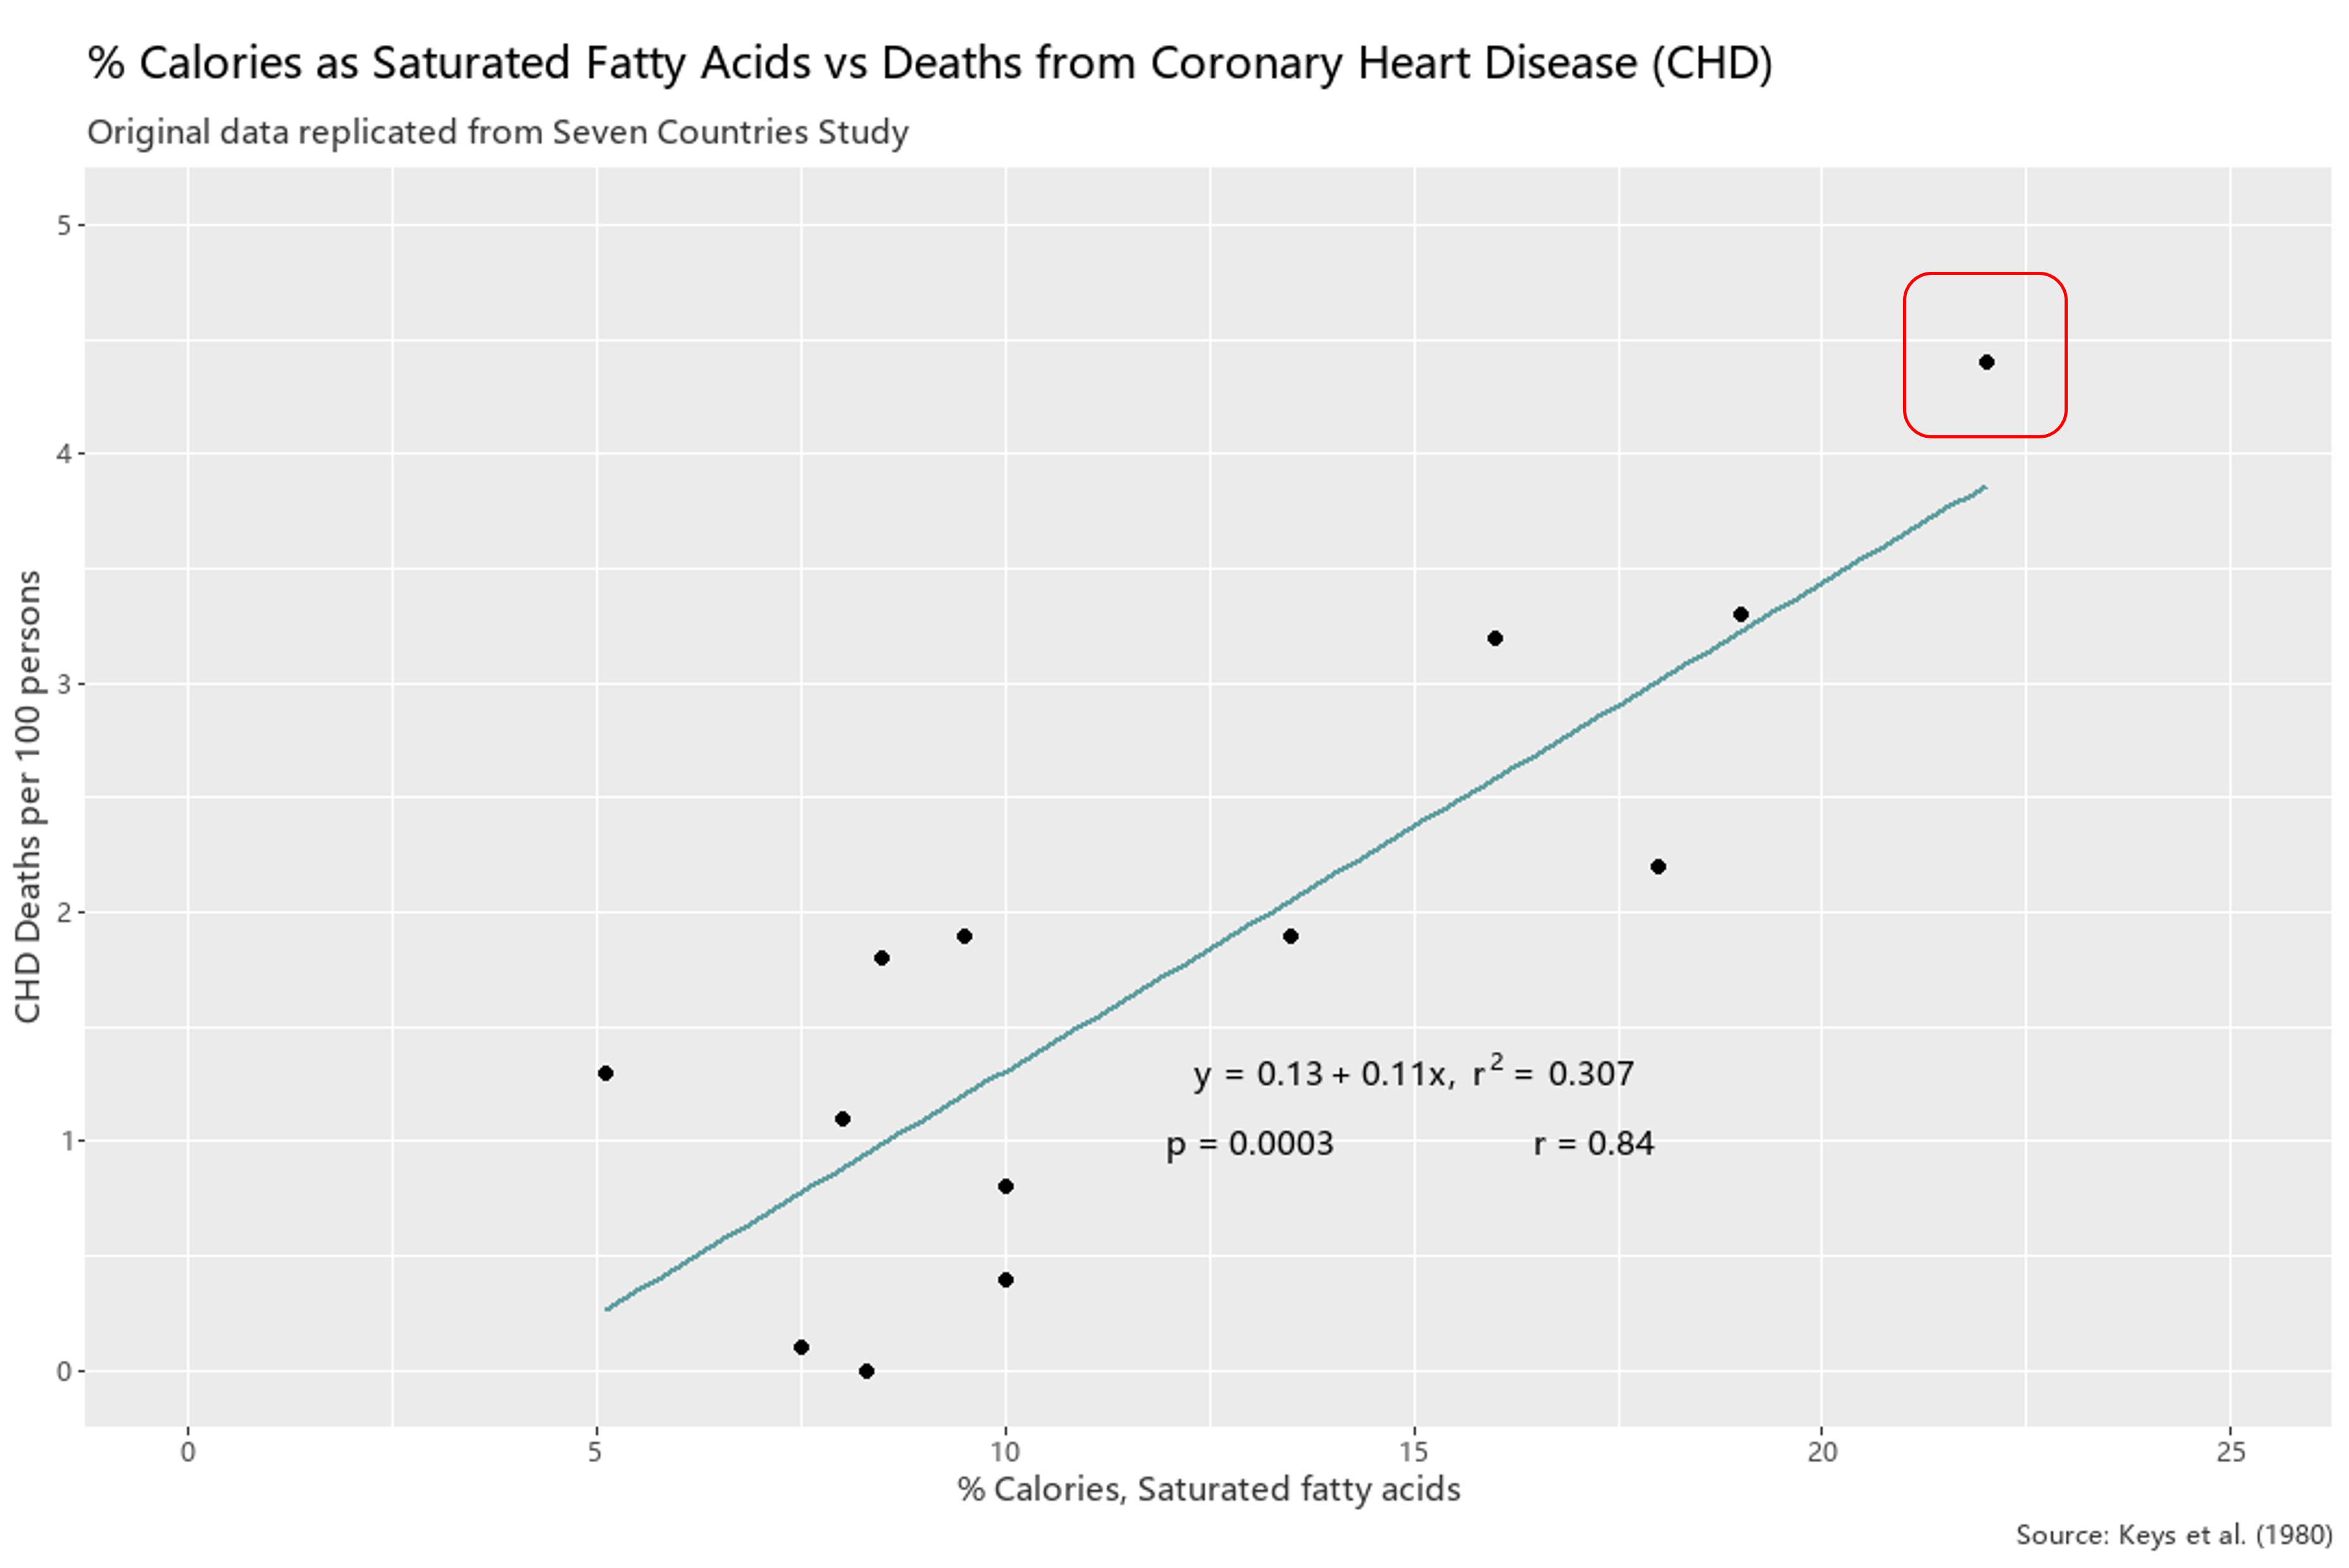
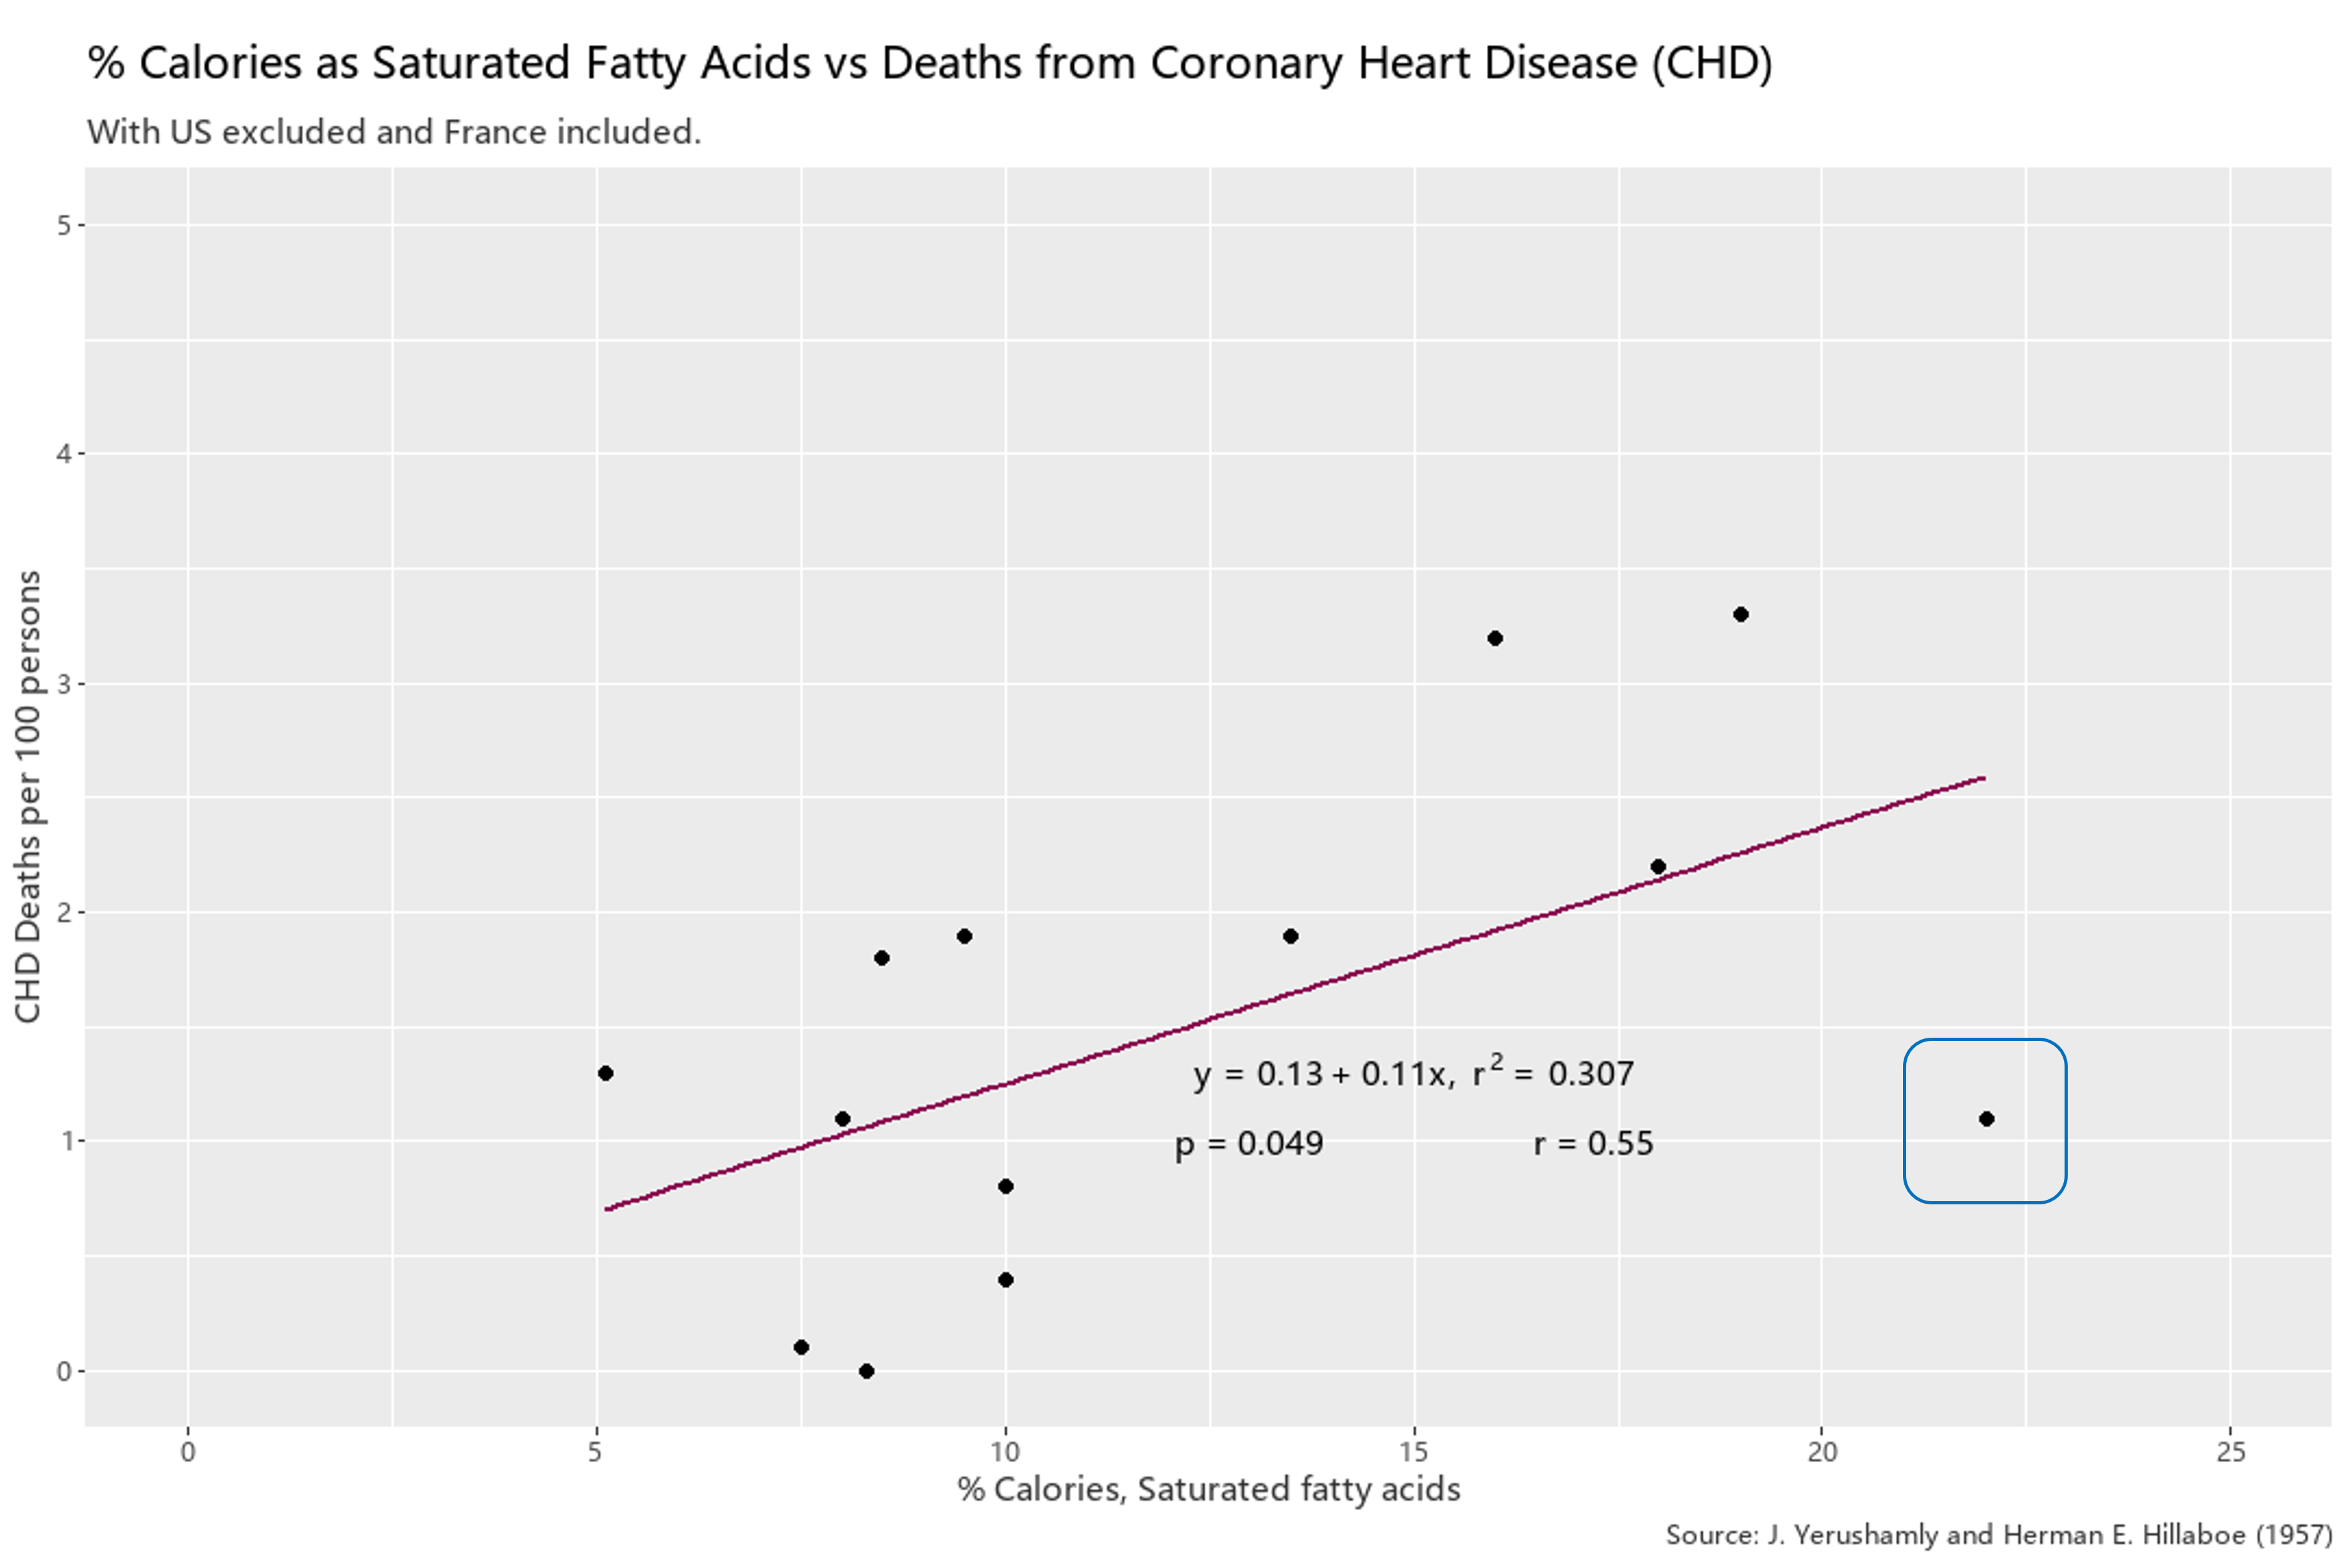
In Figure 9 I recreated Figure 3 which clearly showed a relationship between saturated fat consumption and heart disease, and did some selective editing with the data points. In Figure 10 I excluded the Finnish data point (in the red box in Figure 9), and added an extrapolated French data point, which I’ve circled in blue. I estimated the French data using a paper written in 1993 which states that French have roughly 4x less heart attacks than the Finnish despite consuming roughly the same amount of saturated fat [6].This weakens the SCS conclusions greatly, but of course there is still a correlation with an r value exceeding .5, but p-value barely passes the alpha level of .05.
Concluding Thoughts
To conclude, science must necessarily include and exclude certain elements (like stories), and the inclusion and exclusion of such elements are integral to the telos of the scientific inquiry because in the end it has to “tell a story”. Even the very act of observation, and collecting data is incumbent on the human faculty of attention which must ask questions like “What should be taken into account?”, and “How should these things be accounted for?”. For Keys, he chose 6 countries in his 1953 paper, and later 7 countries in the SCS, but were the countries he chose representative of the grander narrative? And even if were able to get data on every country, or as many as possible, would he have been looking at the right parameters to explain heart disease? The scientific literature today increasingly sees that cholesterol consumption isn’t very relevant to development of heart disease, nor is saturated fat consumption relevant. Instead it is honing in on high ratio of dietary omega-6 PUFAs (commonly consumed via vegetable oils) vs omega-3 PUFAs and omega-9 mono-unsaturated fats. But perhaps there are even more elements that contribute to heart disease, which is the number one killer in most of the developed world.
This of course doesn’t even get into the cases where there are bad actors which use science as a tool for more nefarious goals, the least conspiratorial of those goals being financial. Hence, for the scope of this essay I simply write off Keys’ errors as human failing. He did what he could with the best available evidence at the time. I do not think he maliciously falsified or misrepresented anything (at least for the 1953 and SCS see footnotes for the 1973 experiment). However, this does not mean that industries (such as agricultural, food, and pharmaceutical) did not use his conclusions to their advantage. Lastly, for the scope of this essay I avoided talking about qualitative vs quantitative, and the axiom of scientism that whatever is quantitative is more “objective”. But for now I hope that this helped the reader to “demythologize” science.
Footnotes
There were some interesting things that I have read when writing this essay. I have left links to all such documents below and uploaded my R code for anyone who is interested in the raw data that I used.
Of interest was something called the “Israeli Paradox” which notes the high incidence of chronic illness (comparable to Western counterparts) such as diabetes, heart disease, hypertension, etc in Israel despite the “heart-healthy” Israeli diet which is high in dietary polysunsaturated fat. In fact, it is one of the highest in the world being “8% higher than in the US”, and “10-12% higher than most European countries”. [7] So in addition to the French Paradox there is the Israeli Paradox. There is even something called… the Indian Paradox.
Another was the fact that the literature surrounding cardiovascular disease in the Inuit population seems contradictory. A literature review done in 2002 reviewed seemingly all of the available evidence at the time and concluded “The mortality from all cardiovascular diseases combined is not lower among the Inuit than in white comparison populations.” [8] More recently in 2014, and more surprisingly, Fodor et al concluded The results of these investigations confirm that the prevalence of CAD in Inuits (Eskimos) is as high or higher compared to non-Eskimo populations’, the complete opposite conclusion as that of the papers written in the mid-20th century!. [9] So even here there is conflicting evidence. I incline towards the traditional narrative which is in line with James J DiNicolantonio who believes that the earlier evidence is more representative of the traditional Inuit diet, as even in the 1970s the diets of Inuits were increasingly conforming to modern Western diets, high in sugar and carbohydrates. He writes that refined sugar intake was only 6g of day in 1940s and prior, but bulged to a massive 164-175 g/day or about 40x more sugar [10].
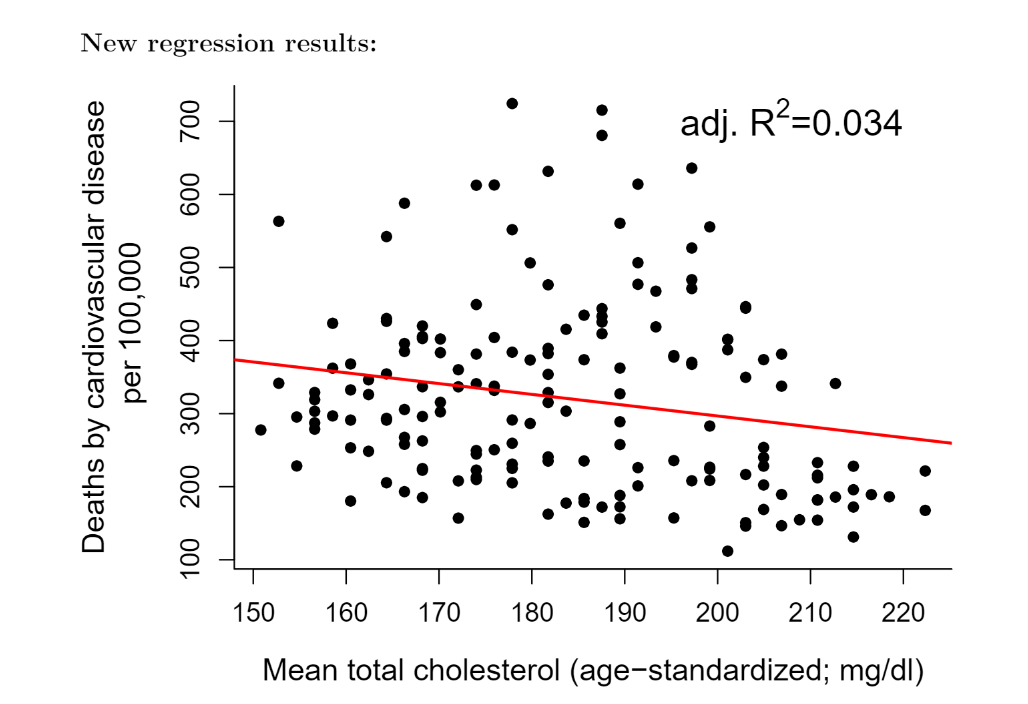
Thirdly, Dr. Alexandar Kubisch a data analyst performed an updated analysis on the Seven Countries Study using recent WHO data available from 2000-2012. I’ve uploaded it to my github and referenced it below [11]. He shows that there is actually a negative correlation between mean total cholesterol and deaths from cardiovascular disease as shown in Figure 11 below. Of course he admits this analysis has limitations and says that mean cholesterol probably has no value for predicting death by CHD, but I found it interesting that using the similar methodology with a much higher sample size gave the complete opposite story as Key’s story.
Lastly…. in 1968 Keys did a 5-yr long double blind randomized control trial with Ivan Frantz with the intervention group having their food replaced with foods that were naturally or artificially high in linoleic acid (main type of PUFA). They found no benefits to the intervention group, in fact “There was a 22% higher risk of death for each 30 mg/dL (0.78 mmol/L) reduction in serum cholesterol in covariate adjusted Cox regression models”. [12] To put it simply, they found that the lower your cholesterol the higher your risk for death. The intervention group had worse outcomes than the baseline group. The results were not published, only partially presented in 1975 at an AHA conference, and partially published in 1989 in Arteriosclerosis a medical journal. It wasn’t until 2013 when the full set of raw data and analysis were discovered Ivan Frantz’s estate. Of course, no one truly knows the reason why they weren’t published, but one can surmise. It isn’t absurd to believe that because Ancel Key’s entire career up to that point depended on the lipid narrative, the results of this experiment being far too dangerous to his credibility and established work to publish.
References
[1] Atherosclerosis: a problem in newer public health
[2] Seven Countries Study - Cross Cultural Findings
[3] Dietary Fat and Its Relation to Heart Attacks and Strokes
[4] Fat in the diet and mortality from heart disease; a methodologic note
[5] Mortality due to heart disease among Alaskan natives, 1955-65.
[9] “Fishing” for the Origins of the “Eskimos and Heart Disease” Story: Facts or Wishful Thinking?
[11] The 171 countries study - revisiting the classic by Ancel Keys
[13] Epidemiological Studies in the Upernavik District
Share